Birthday Paradox Simulator
An interactive web application that demonstrates the Birthday Paradox through real-time simulations and probability visualizations.
About the Project
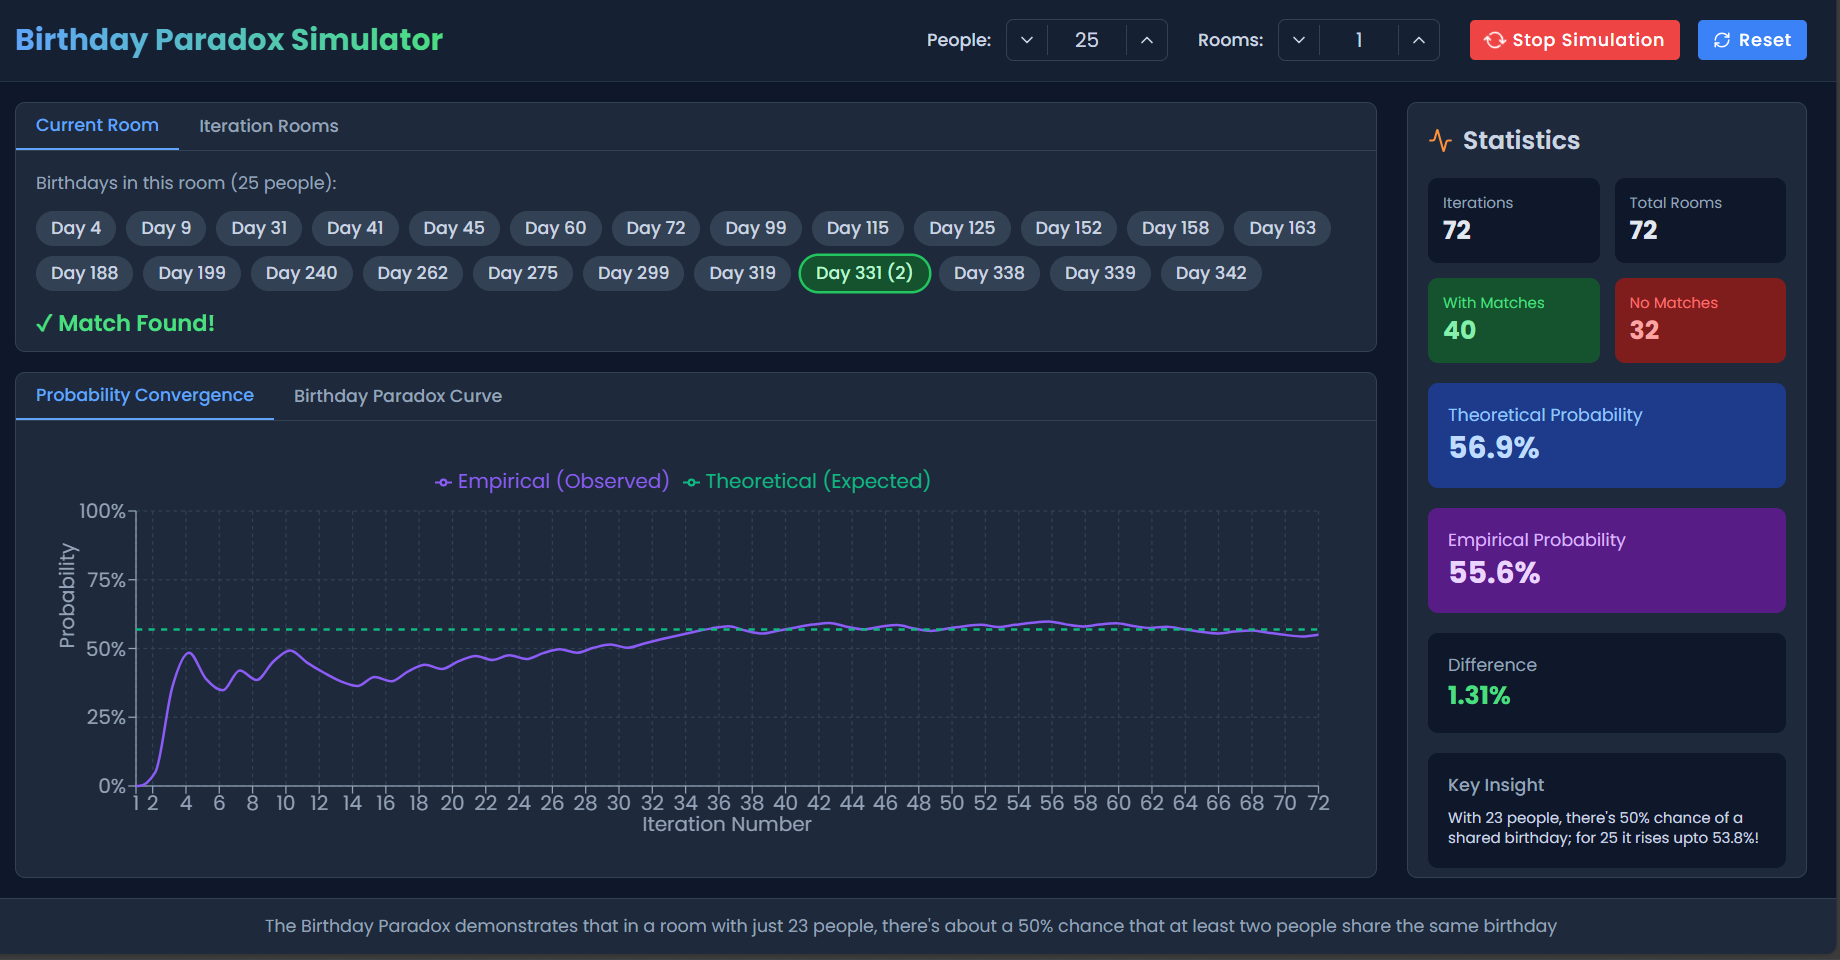
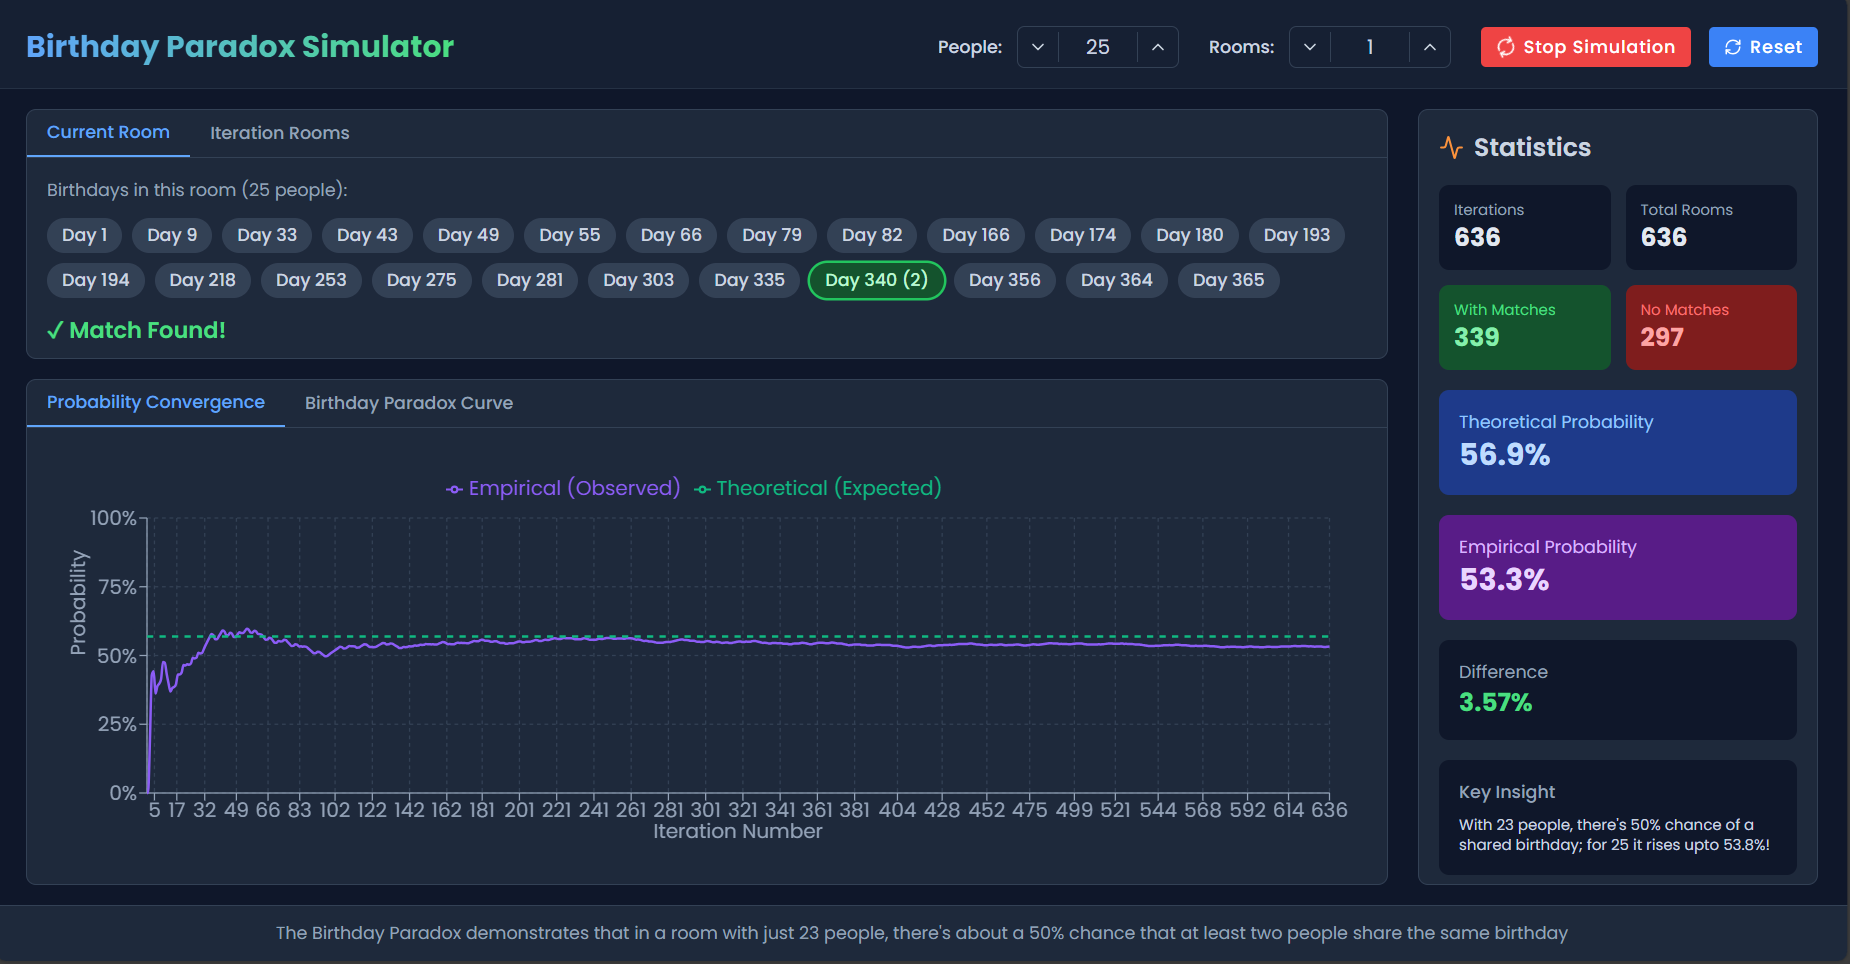
The Birthday Paradox Simulator is an educational web application that brings one of probability theory's most counterintuitive concepts to life. The simulator demonstrates how in a room of just 23 people, there's approximately a 50% chance that at least two people share the same birthday - a result that often surprises people when they first encounter it. This interactive tool allows users to run multiple simulations with different parameters, watching as empirical results converge toward theoretical probability. The application features dual visualizations: a probability convergence graph showing how results approach theory over iterations, and a complete birthday paradox curve displaying probabilities for different group sizes. The simulator serves as both an educational tool and a practical demonstration of how our intuition about probability can be misleading, with applications extending to cryptography, hash functions, and collision detection in computer science.
Key Features
- • Interactive controls for adjusting number of people and simulation rooms
- • Real-time simulation with visual feedback and match highlighting
- • Dual visualization system with convergence and paradox curve graphs
- • Detailed room view showing individual birthdays and matches
- • Statistical dashboard tracking iterations, matches, and probability differences
- • Theoretical probability calculations using mathematical formulas
- • Continuous simulation mode with real-time updates
- • Educational content explaining the mathematical principles
Screenshots
Challenges & Solutions
- • Implementing accurate probability calculations for large group sizes
- • Creating smooth real-time visualizations without performance degradation
- • Designing intuitive interfaces that make complex mathematics accessible
- • Balancing educational content with interactive engagement
- • Optimizing simulation algorithms for continuous operation
- • Presenting statistical concepts in visually compelling ways
Lessons Learned
- • How to make complex mathematical concepts accessible through visualization
- • The importance of empirical validation in probability education
- • Techniques for creating educational software that engages and informs
- • Best practices for real-time data visualization in web applications
- • The value of interactive learning in understanding counterintuitive concepts
- • How to bridge the gap between theoretical mathematics and practical demonstration